
What Is RMM Ticketing, and Why Does It Matter More Than People Think
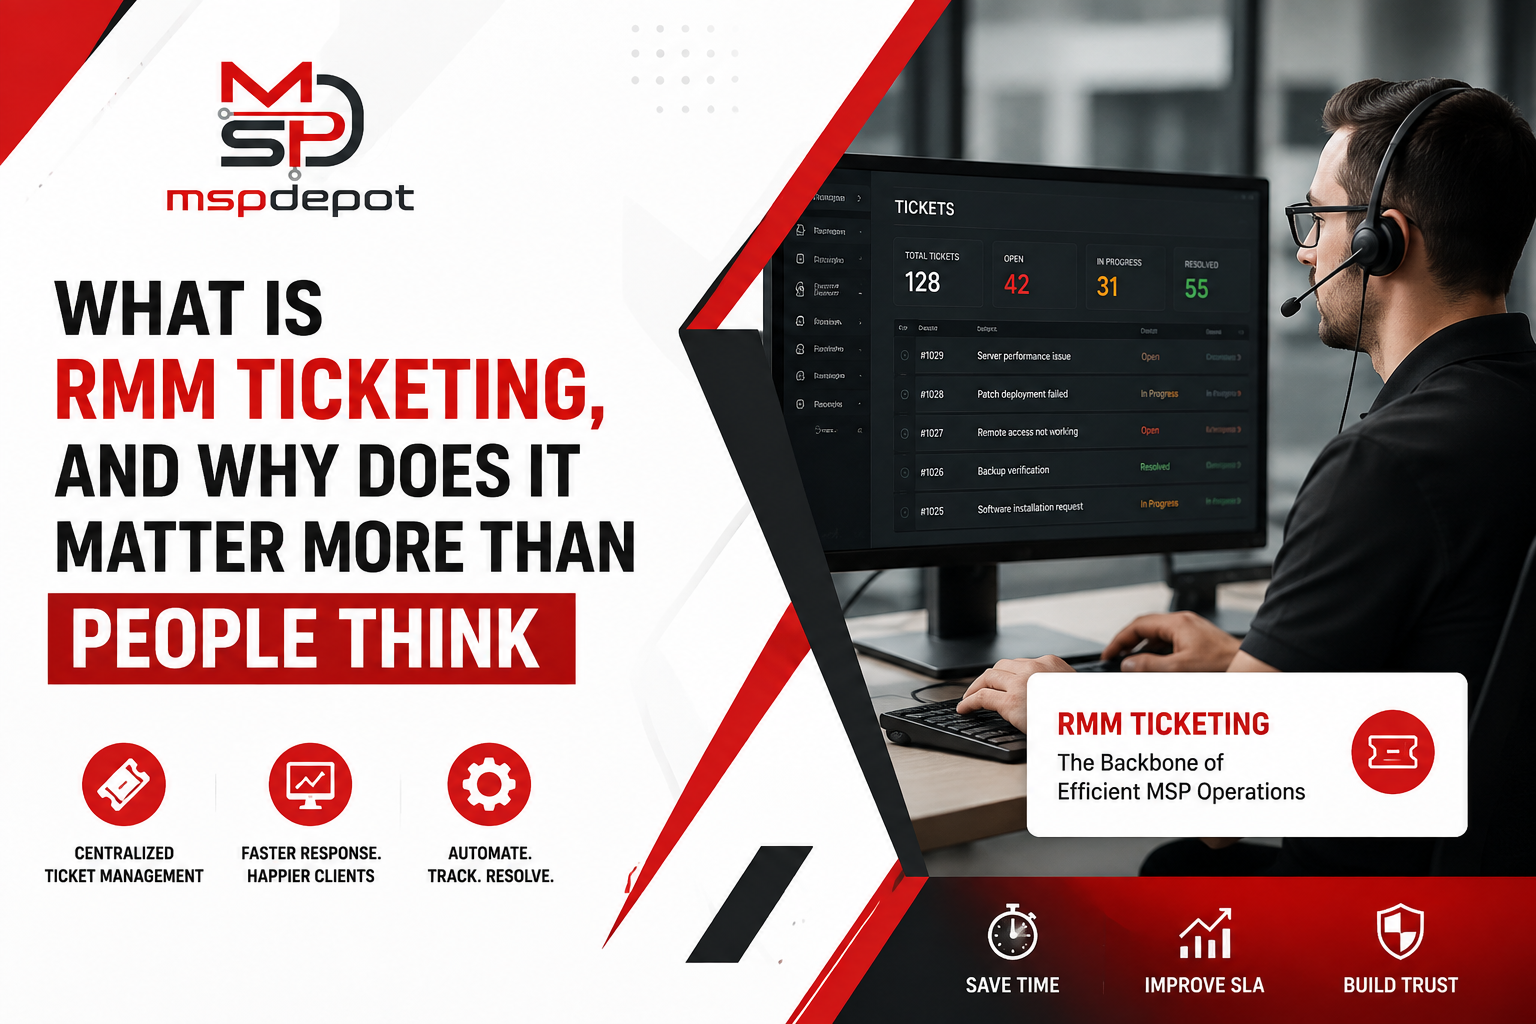
Ask ten people in the MSP world to define RMM ticketing and you’ll probably get somehow ten different answers. Some describe it as a support desk with monitoring bolted on. Others call it a monitoring tool with a ticketing system stapled to the side. Both descriptions miss the point a bit, because RMM ticketing done properly isn’t two separate tools sharing a login screen. It’s one workflow where monitoring and service delivery are the same continuous process.
That differences matter, because it explains why so many MSPs fed up with tools that technically have both an RMM module and a ticketing module feels useless in daily life.
Breaking Down the Two Halves
It helps to explain two of them separately first before telling why they need to be joined at the hip.
RMM stands for remote monitoring and management. It’s the layer that watches every endpoint under an MSP’s care, checking device health, monitoring running services, pointing anything that drifts outside of normal. It’s also the layer that lets a technician actually reach into a device remotely and do something about a problem, whether that’s running a script, pushing a fix, or opening a remote session to poke around directly.
Ticketing is the system that organizes the human side of support. It tracks who reported an issue, what the issue actually is, who’s responsible for fixing it, how urgent it is, and what’s already been tried. It’s also usually where client communication happens, where SLA timers live, and where a technician’s workload divides in team.
On their own, each of these is useful. Put together properly, something better happens. An alert generated by the RMM layer doesn’t just sit on a dashboard waiting for a human to notice it. It becomes a ticket automatically, already carrying the device context a technician would otherwise have to go dig up manually. That’s the actual definition of RMM ticketing worth caring about. Monitoring and service delivery working as one continuous loop instead of two systems that happen to share a vendor.
Why the Manual Handoff Is the Real Problem
Here’s where a lot of MSPs feel pain without always being able to name exactly why. Plenty of tools on the market technically include both monitoring and ticketing. The issue is what happens in between an alert firing and a technician actually starting work on it.
In a poorly integrated setup, an alert shows up in a monitoring dashboard. Someone notices it eventually, maybe minutes later, maybe hours, depending on how often anyone’s actually looking. That person then manually creates a ticket, describes the issue, figures out which client and which device it belongs to, and often goes hunting through a separate system to find out what that device’s history looks like. Is this the third time this printer driver crashed this month? Is this the same laptop that had a failing hard drive flagged two weeks ago? None of that context transfers automatically, so the technician either has to remember it, go hunting for it, or start from scratch.
That gap between detection and action is where response time actually lives, and it’s almost entirely a tooling problem rather than a staffing problem. A properly connected RMM ticketing workflow removes the manual handoff entirely. The alert becomes the ticket. Device history is already attached. The technician opens the ticket and is looking at exactly what they need without a single extra click to go find it somewhere else.
What a Well Built Ticketing Workflow Actually Includes
A ticketing system built to work alongside RMM data, rather than next to it, generally needs to cover a few things well.
- Client aware ticket intake matters first, since every ticket needs to be tied to the right client, the right contact, and the right device without a technician manually cross referencing three different records.
- Alert to ticket automation is the piece already described, where monitoring triggers turn into actionable work items without a human bridging the gap.
- Asset context inside the ticket itself means a technician doesn’t have to leave the ticket screen to see what device they’re dealing with, what its patch status is, what its recent history looks like, or what scripts have already run against it.
- SLA timers and priority queues need to stay visible and accurate, not just recorded somewhere for a report later.
- Technician workload visibility lets a manager or owner see who’s buried and who has capacity before a client’s ticket sits untouched for three days.
- Escalation history, along with a full activity log, needs to be preserved so nothing gets lost when a ticket gets handed from one technician to another, or when a client calls back asking for an update.
None of these are exotic features on their own. What actually makes the difference is whether they’re genuinely connected to the monitoring layer, or whether they exist as a separate module that happens to be sold under the same subscription.
The Automation Angle
Once alerts reliably become tickets with full context attached, the next natural step is closing the loop even further with automation. A well built RMM ticketing platform lets technicians run scripts directly from an alert or a ticket, without switching to a different tool or opening a separate remote session just to run a fix that’s already been written and tested.
This is where a script library becomes genuinely valuable than anything else. Common remediation tasks, clearing a stuck print spooler, restarting a hung service, freeing up disk space on a drive that’s nearly full, can get triggered right from the alert that flagged the problem in the first place. Some can even be set to run automatically the moment a known issue pattern shows up, with approval gates in place for anything touching a production system where a human should confirm before action gets taken.
The practical effect is that a meaningful chunk of tickets can get resolved before a technician ever manually touches them, or at the very least, the technician’s first action on a ticket is confirming that it can be fixed instead of starting the diagnosis from scratch.
How This Shows Up in Actual MSP Operations
The value of properly connected RMM ticketing is easiest to see by comparing two mornings.
In a disconnected setup, a technician starts the day checking a monitoring dashboard, and manually creates tickets for the ones that seem to need attention while hoping nothing important got missed among the ones that didn’t obviously stand out. Client calls come in through a separate channel, sometimes duplicating an issue that’s already flagged in monitoring without anyone realizing it.
In a connected setup, the technician opens a queue that already reflects reality. Alerts from overnight have already become prioritized tickets, each carrying device history and context. Anything that had an automated remediation script attached already ran, and either resolved the issue or logged why it couldn’t. The technician’s actual job becomes working through a prioritized, pre contextualized list rather than doing detective work before the real troubleshooting even starts.
That difference compounds across a team and across a client base. It shows up in faster response times, fewer duplicate tickets, less administrative overhead per ticket, and eventually in whether a client feels like their MSP is on top of things or perpetually one step behind.
Why This Also Changes How Teams Grow
There’s a side effect of well connected RMM ticketing that doesn’t get talked about enough, and it’s what happens as an MSP adds technicians. In a disconnected setup, onboarding a new tech means teaching them two separate tools and hoping they learn to bridge the gap between them the same way everyone else on the team already has, informally, through habit. That knowledge rarely gets written down anywhere. It just lives in people’s heads.
When monitoring and ticketing are the same workflow, a new technician learns overall one system, and the context they need is already sitting in front of them the moment they open a ticket. That shortens ramp up time noticeably, and it also means a smaller team can handle more clients without things quietly falling through the cracks whenever someone’s out sick or on vacation. For a growing MSP trying to scale technician headcount without scaling chaos at the same rate, this matters more than it looks like on paper.
MSPDepot’s Approach to RMM Ticketing
MSPDepot was built around the idea that RMM and ticketing should never have been separate products glued together in the first place. Endpoint data feeds tickets directly, so an alert about a failing disk or a missed patch doesn’t need a manual step to become actionable work. Tickets carry asset context automatically, SLA timers and priority queues stay visible without extra configuration, and technicians can run scripts straight from an alert without switching tools or losing the thread of what they were working on.
Because the platform runs on unlimited endpoint pricing per technician rather than per device, there’s no incentive to under enroll devices just to keep monitoring costs down, which means the ticketing side is always working from a complete picture of a client’s environment rather than a partial one. Combined with technician workload visibility and escalation tracking, the goal is straightforward. Turn the gap between something breaking and someone fixing it into as short and automatic a process as possible.
The Real Takeaway
RMM ticketing isn’t a feature category to check off a list. It’s a description of how monitoring and service delivery should function as a single loop instead of two disconnected systems that happen to be sold together. MSPs evaluating a platform should look past whether both capabilities technically exist and ask a more specific question. When an alert fires, how many manual steps happen before a technician is actually looking at a contextualized, actionable ticket? The shorter that gap, the more time technicians spend actually solving problems instead of assembling the information they need just to get started.