
How to Check SSD Health Before Your Drive Quits on You
An SSD rarely warns you the way an old spinning drive did. No clicking, no grinding, no rattle through the case. The machine boots fine on Tuesday, and by Wednesday the drive is stuck read-only or gone from the BIOS.
Your SSD has been keeping records the whole time, though. Every terabyte written, every spare block burned through, how hot it runs, how many errors the controller cleaned up.
Here’s how to pull those numbers out, and which ones matter.
What “SSD Health” Really Measures
People talk about SSD health like it’s one score. It isn’t. Three things get tracked, and they fail in different ways.
Write endurance: NAND cells survive a limited number of program and erase cycles. Makers publish this as TBW, short for terabytes written. A 1TB Samsung 990 Pro is rated at 600TB, and the 2TB model doubles that to 1,200TB, so a bigger drive buys more headroom.
Spare blocks: Every SSD ships with hidden reserve capacity you can’t see or format. When a block stops holding data reliably, the controller retires it and swaps in a spare. Those spares run out, and watching them drain is your best early signal.
Errors and controller faults: The category nobody plans for. A controller chip or power regulator can die on a drive that’s barely been used, and no wear number predicts it.
One thing before you panic over a wear percentage: hitting your TBW rating is not a death sentence. In one long write test, Samsung 990 Pro units rated for 1,200 TB kept going past 20 to 31 petabytes, roughly 17 to 26 times the published figure.
How to Check SSD Health in Windows 11 Without Any Software
Windows 11 reads the drive’s own report and shows it in Settings; no download needed.
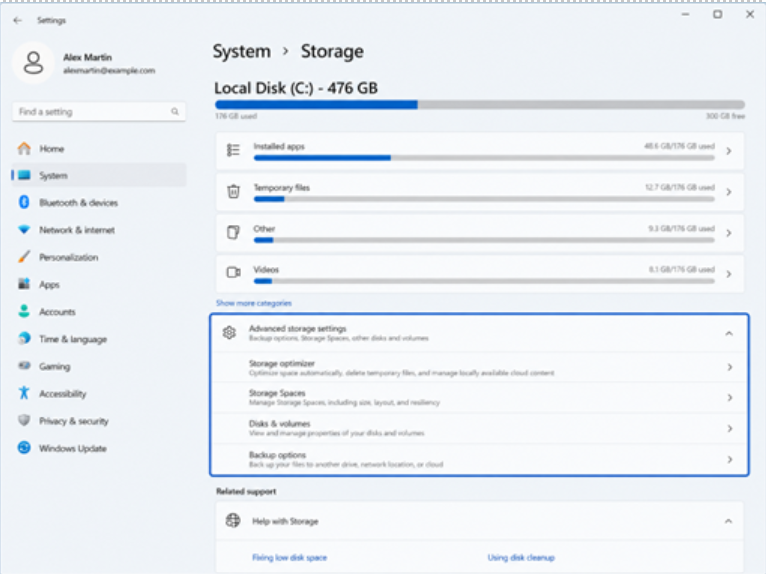
- Press Win + I to open Settings.
- Click System, then Storage.
- Scroll past Storage management and open Advanced storage settings.
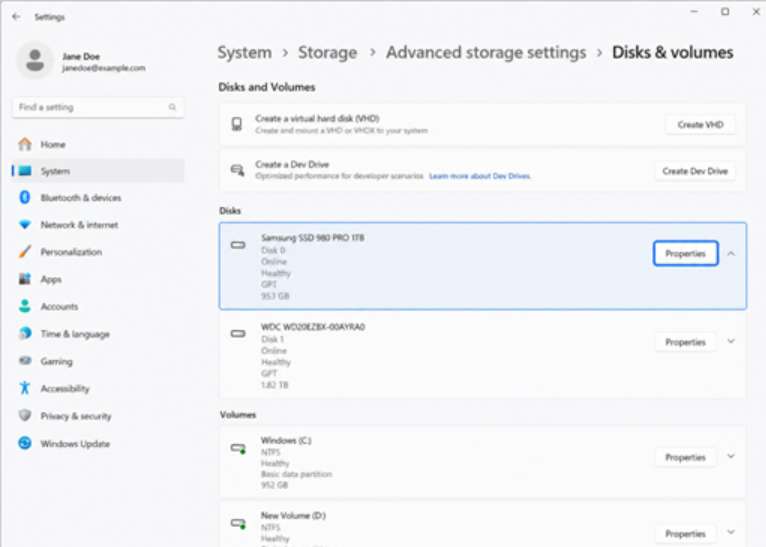
- Click Disks & volumes.
- Pick the physical SSD, not one of its partitions, and click Properties.
- Look at the Drive health section.
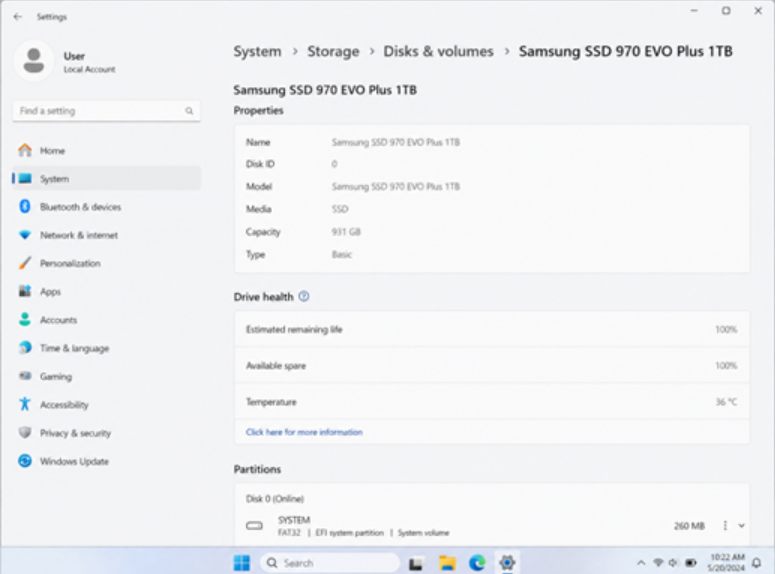
Three readings show up. Estimated remaining life is the approximate percentage used, based on the maker’s own prediction, and it can sit below 0% without meaning the drive has failed. Available spare is a normalized 0% to 100% reading of leftover reserve. Temperature is in Celsius.
Two things many people skip, but both save you a support call:
- Windows reads this data from NVMe SSDs only: On a SATA SSD or a plain hard disk, the Drive health box stays empty or doesn’t appear. Nothing is broken. Windows just can’t ask those drives for the same report.
- You’ll also hit a permission prompt on newer builds: Since Windows 11 build 26100.7705 (24H2) and 26200.7705 (25H2), opening Storage settings triggers User Account Control. Click Yes.
Windows pushes a desktop alert when things go badly wrong. “Spare capacity is low” means the reserve dropped below the recommended level. “Reliability is degraded” means media or internal errors are hurting the drive.
“Drive is set to read-only” means files still read, but nothing new gets written, which is your cue to copy everything off immediately.
Reading SSD Health With PowerShell
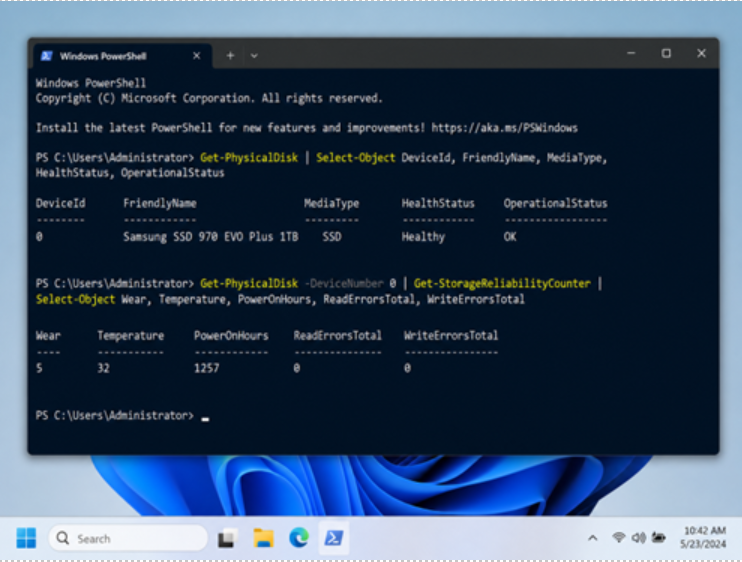
PowerShell reads SATA drives too, which makes it the better tool for mixed hardware. Run it as administrator:
Get-PhysicalDisk | Select-Object DeviceId, FriendlyName, MediaType, HealthStatus, OperationalStatus
That gives a row per drive with a Healthy, Warning, or Unhealthy verdict. For raw numbers, feed the device number into the reliability counters:
Get-PhysicalDisk -DeviceNumber 0 | Get-StorageReliabilityCounter | Select-Object Wear, Temperature, PowerOnHours, ReadErrorsTotal, WriteErrorsTotal
Wear is the percentage of rated life consumed, so it counts up rather than down. PowerOnHours shows how long the drive has really been running, handy when someone swears a machine is “practically new.” Error totals should sit near zero.
image :
The WMIC Command in Older Guides No Longer Works
Plenty of articles still tell you to run wmic diskdrive get status. Don’t bother on a current machine.
WMIC was disabled by default in Windows 11 23H2 and 24H2, stripped out on upgrade to 25H2, and as of the August 2026 preview update, it’s gone completely, with no Feature on Demand to add it back.
Microsoft pulled it because attackers used it to delete shadow copies and add Defender exclusions. WMI itself is untouched, so PowerShell covers everything wmic did.
CrystalDiskInfo Gives You the Full Picture
Built-in tools hand you a summary. CrystalDiskInfo hands you every attribute the drive will report, on SATA and NVMe alike, for free.
Grab the portable version if you’d rather not install anything. A coloured block sits at the top, blue for Good, yellow for Caution, red for Bad, and the attribute table underneath holds the real data.
Image :
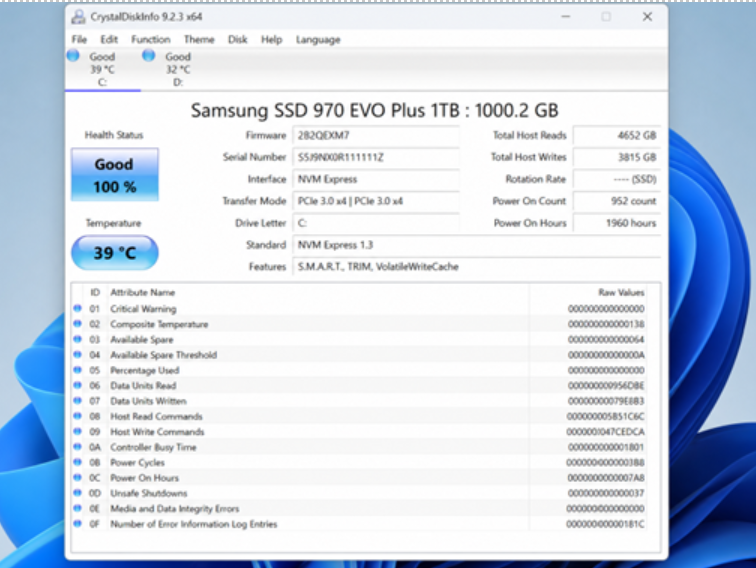
One quirk trips people up. Raw values display in hexadecimal by default, so a figure that looks alarming may be normal once converted. Switch to Function > Advanced Feature > Raw Values > 10 [DEC].
SMART Attributes for SSD Drives That Actually Matter
SMART can list thirty-odd attributes. Maybe eight say anything useful about an SSD.
| ID | Attribute | What a healthy drive looks like |
|---|---|---|
| 05 | Reallocated Sector Count | Zero. Any climb means blocks are failing |
| 09 | Power-On Hours | Context only, no pass or fail |
| AD | Wear Leveling Count | Average erase cycles used across the NAND |
| B1 | Wear Range Delta | Small gap between least and most worn blocks |
| B7 | Runtime Bad Block | Zero |
| BB | Reported Uncorrectable Errors | Zero. Anything higher is a real problem |
| C2 | Temperature | Under 70°C during sustained work |
| C7 | UDMA CRC Error Count | Zero, and a rising count points at the cable |
| E7 | SSD Life Left | Starts at 100 and counts down |
| F1 | Total LBAs Written | Your running total for TBW maths |
C7 fools people constantly. CRC errors are transfer faults between the drive and motherboard, pointing at a loose or damaged SATA cable far more than a failing drive. Reseat it, swap it, see whether the count stops growing.
NVMe drives report a different set of fields:
- Percentage Used climbs from 0 toward 100 as rated endurance gets consumed.
- Available Spare and Available Spare Threshold work as a pair. The threshold is commonly 10%, and dropping below it fires the low spare warning.
- Media and Data Integrity Errors and Critical Warning should both read zero. Your real red flags.
- Unsafe Shutdowns counts power cuts during writes. High numbers on a desktop with no UPS explain a lot of corruption.
- Data Units Written is your write total. Each unit is 512,000 bytes, so divide by 1,953,125 to get terabytes.
How to Check SSD Health Percentage and Remaining Life
Take Windows at its word, and the arithmetic is done for you. 94% estimated remaining life means 94% of rated endurance is left.
Doing the maths yourself tells you more. Say CrystalDiskInfo reports 38TB of host writes on a 1TB drive rated at 600TBW. That’s about 6% of the budget gone, and two years in service puts you on track for roughly 30 years before wear matters.
Which is why a falling percentage rarely justifies panic. Direction counts more than the number. A drop from 100% to 96% over a year is fine.
A drop of 15 points in three months means something is writing constantly, and the fix is finding out what.
Two readings overrule the percentage entirely. If Available Spare is falling or Reallocated Sectors are climbing, the drive is physically failing, whatever the rated life says.
Vendor Tools Are the Only Way to Update Firmware
Firmware fixes cut excessive write amplification and correct wear-leveling bugs, and only the maker’s own utility installs them.
Samsung Magician, WD Dashboard (which also covers SanDisk), Crucial Storage Executive, Kingston SSD Manager, and Solidigm Storage Tool cover most drives.
Checking SSD Health on macOS and Linux
macOS: Open Disk Utility from Spotlight, pick the drive, and read the S.M.A.R.T. Status field. Verified means no critical faults, but there’s no temperature or wear figure, so install smartmontools through Homebrew and run smartctl -a disk0 for details. Apple silicon storage is soldered to the board and can’t be swapped on its own.
Linux: Install smartmontools and nvme-cli, then run lsblk -d -o name,tran to sort SATA from NVMe. Use sudo smartctl -a /dev/sda for SATA and sudo nvme smart-log /dev/nvme0n1 for NVMe, which returns critical_warning, available_spare, and percentage_used in one block.
HDD vs SSD: Why the Health Checks Are Different
The HDD vs SSD split changes what you watch for, and treating both the same is how drives get missed.
An HDD fails mechanically: platters, spindle motor, actuator arm, read heads. SMART tracks spin-up time and seek error rate, and those faults build slowly enough that a monthly check catches them. Hard drives also warn you out loud, and clicking or grinding means back up now.
An SSD has no moving parts, so nothing wears mechanically and nothing makes noise. Wear happens inside the flash cells and shows up as a percentage.
The trade-off is that an SSD fails all at once. A dying hard drive still lets you recover most files. A dead SSD controller doesn’t.
So on an HDD you listen for symptoms. On an SSD, you read a report, because the symptoms may never arrive.
Signs Your SSD Is on the Way Out
- Files that won’t save, or come back corrupted after saving fine
- The drive turning read-only without warning
- Freezes lasting several seconds during file operations
- The drive vanishing from BIOS and reappearing after a reboot
- Bad block errors in Event Viewer under Windows Logs > System
- Failed boots that clear up after a restart, then come back
Any of those on a drive holding real data means back it up first and diagnose second. Benchmarking a drive that’s already dropping out adds stress and burns time you could spend copying files.
As for how regularly to check: every couple of months covers a home machine, monthly for a work laptop or anything holding client data, and straight away after a power cut or heat problem.
Whatever the numbers say, keep backups running. SMART misses failures, and a drive can die between two clean readings.
Frequently Asked Questions (FAQs)
How do I check my SSD health?
Open Settings, go to System > Storage > Advanced storage settings > Disks & volumes, select your SSD and click Properties. Drive health shows estimated remaining life, available spare, and temperature. For SATA drives or more detail, CrystalDiskInfo reads the full SMART list.
How do I check SSD health in Windows 11?
The Settings route above is quickest. PowerShell gives more: Get-PhysicalDisk for the verdict, Get-StorageReliabilityCounter for wear, temperature, and power-on hours. Settings reads NVMe drives only, so SATA SSDs need PowerShell or CrystalDiskInfo.
How can I check SSD health without software?
Windows 11 Settings and PowerShell are both built in. On macOS, Disk Utility reports SMART status. On Linux, smartctl and nvme-cli come from your package manager. Skip any guide recommending wmic, since Microsoft finished removing it from Windows 11 in 2026.
How can I tell if my SSD is healthy?
Reallocated sectors and uncorrectable errors should read zero, available spare should sit near 100%, temperature should stay under 70°C under load, and remaining life should fall slowly. Zero errors plus slow wear means the drive is fine, whatever the headline percentage says.
How do I check the lifespan of my SSD?
Find your model’s TBW rating on the maker’s spec sheet, then compare it against total host writes from CrystalDiskInfo or the Data Units Written field on NVMe. Divide writes by rating for the fraction used, then by the drive’s age to project forward. Most consumer drives last decades.
How do I check SSD health percentage?
Windows Settings shows estimated remaining life as a percentage for NVMe drives. CrystalDiskInfo shows one at the top of its window for SATA and NVMe alike. PowerShell’s Wear counter shows the same figure inverted. All three read the same SMART data, so they should agree.